Supplier Scorecards
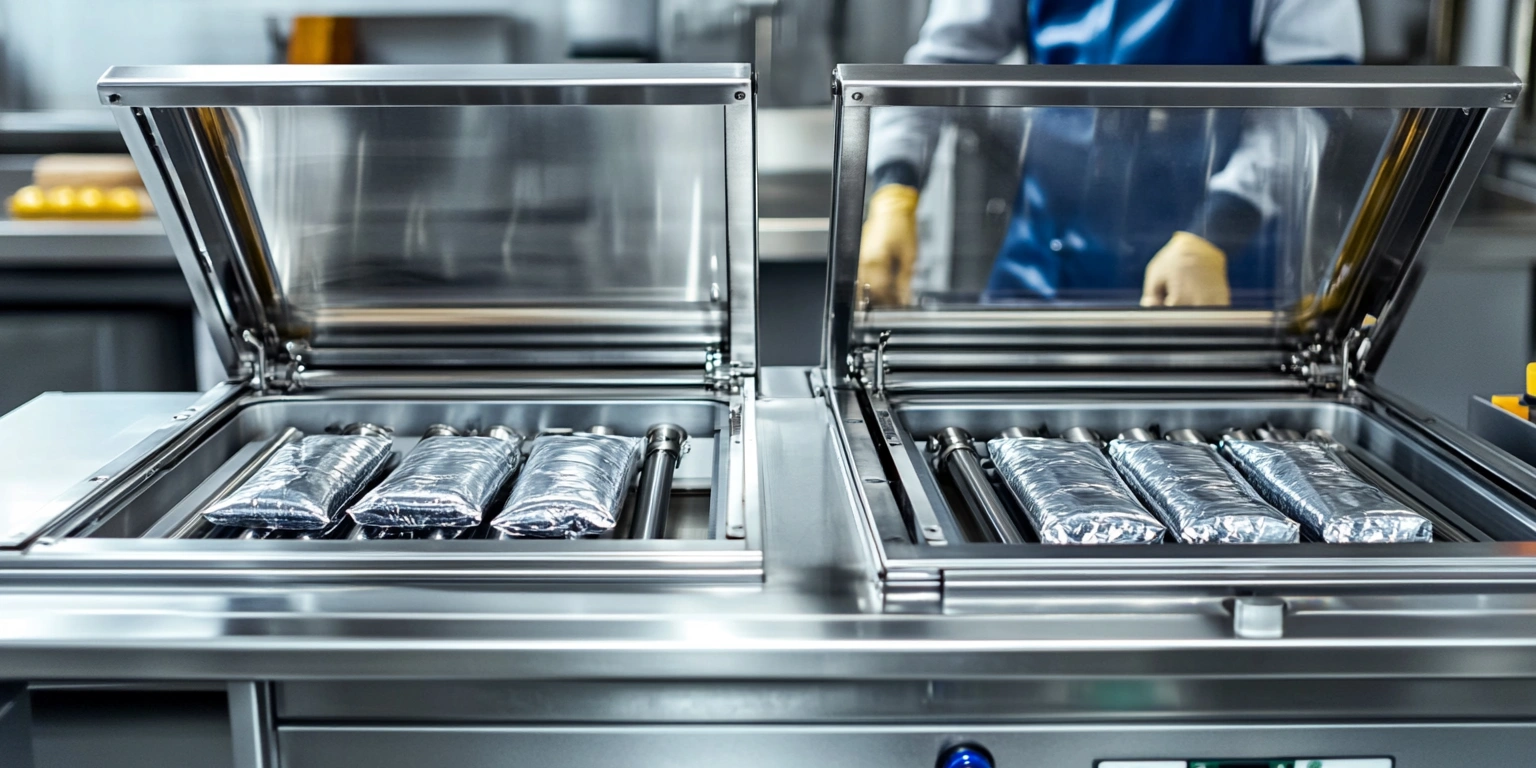
In packaging automation for case packers, palletizers, and vacuum sealing cells, supplier scorecards benefit from AI models that quantify operational risk and value. A pragmatic judgment: vendors integrating **ASFL** workflows, computer vision, and compliant data capture yield steadier OEE from 62% to 74% on snack lines. Method: centerline critical parameters; enforce FAT/SAT records; embed GS1 aggregation. Evidence anchors: OEE tracked per shift; ISO 13849-1 Performance Level d (PL d) validated in the machine safety circuit. For can vacuum sealer modules, machine learning flags drift in seal temperature and vacuum dwell time before ppm defects rise. Execute three actions—standardize recipes, tune servo profiles, and lock digital signatures under 21 CFR Part 11—to stabilize Changeover within 18–22 minutes.
Economic Pressures on CapEx and OpEx Decisions
Conclusion: scorecards should rank suppliers by payback months, kWh/pack, and FPY%. A baseline snack line runs at 0.12 kWh/pack; proposals showing 0.09 kWh/pack with OEE ≥72% move up. Apply ISO 50001 for energy management; record approvals in Annex 11-compliant systems. Steps: quantify debottleneck vs add-line; model Payback at 12–24 months; centerline setpoints; standardize maintenance; tune VFDs. Set risk boundaries: reject offers with FPY < 97% or Payback > 24 months. Governance: finance and operations co-sign changes under SOP-EC-014 with traceability to SAT reports. References: ISO 50001; 21 CFR Part 11; ISA-95; FAT/SAT minutes.
To reduce OpEx volatility, embed predictive energy and scrap forecasts in the sourcing process. Track ppm defects under ISO 2859-1 AQL 1.0 sampling; tie Changeover to 15–25 minutes by SKU. Use a compliance matrix to verify GS1 aggregation for downstream WMS. Steps: run sensitivity analysis; phase investments; require MTBF > 2,500 hours; audit PLC code; verify lockout/tagout per NFPA 70. Risk boundary: if kWh/pack exceeds 0.11 at nominal 300 packs/min, trigger re-bid. Governance: procurement issues scorecards quarterly with CFO sign-off and SAT addenda. References: GS1 General Specifications; ISO 2859-1; NFPA 70; procurement minutes.
| Item | Target | Current | Improved | Units |
|---|---|---|---|---|
| OEE | 75 | 62 | 74 | % |
| Changeover | 18 | 27 | 20 | min |
| Energy | 0.09 | 0.12 | 0.095 | kWh/pack |
| FPY | 98.0 | 96.5 | 97.8 | % |
| Payback | 18 | — | 16 | months |
Debottleneck vs Add-Line
Focus: OEE uplift from debottlenecking vs new assets (Payback 14–22 months). Standard: ISA-95 for production model; records via 21 CFR Part 11. Steps: map constraints, simulate throughput, revise centerlines, validate SAT. Risk boundary: reject if MTTR > 45 minutes at target rate.
Payback Sensitivity
Analyze ±10% energy price shifts; kWh/pack at 0.09–0.11. Standard: ISO 50001; evidence: energy logs. Steps: build scenarios, tune VFDs, negotiate PPA, set alarms. Risk boundary: if Payback > 24 months, escalate to steering committee.
Implementing Smart Sensors and Data Collection Tools
Conclusion: intelligent sensing and compliant data capture raise FPY and reduce MTTR variance. Install thermal cameras for seals, torque sensors for cappers, and AI vision for label placement. Metric: ppm defects drop from 2,200 to 800 under ISO 2859-1 AQL 1.0. Ensure ISO 13849-1 PL d safety; store batches per Annex 11/21 CFR Part 11. Steps: standardize sensor specs; calibrate monthly; centerline thresholds; tune inspection ML models; audit trail daily. Risk boundary: alert if FPY dips below 97% for three runs. Governance: QMS owner maintains IQ/OQ/PQ dossiers linked to SAT. References: ISO 13849-1; ISO 2859-1; Annex 11; 21 CFR Part 11.
For best vacuum sealer for freezing meat evaluation, vision checks seal integrity and leak rate using chamber pressure curves. Track MTBF at 2,500–3,500 hours; maintain MTTR under 40 minutes. Implement GS1 serialization for cases to trace defect clusters. Steps: deploy can vacuum sealer vacuum transducers; retrain deep learning weekly; set SPC alarms; verify PLC safety interlocks. Risk boundary: stop line if seal leak rate exceeds 3% in a 200-pack sample. Governance: digital batch records reviewed weekly by QA. References: GS1 General Specifications; IQ/OQ/PQ records; SPC charts; SAT reports.
| Clause | Control/Evidence | Cadence/Owner |
|---|---|---|
| ISO 13849-1 PL d | Safety circuit validation | Annual / EHS |
| ISO 2859-1 AQL 1.0 | Sampling plan & defect logs | Per batch / QA |
| GS1 | Serialization/aggregation | Per run / Operations |
| 21 CFR Part 11 | Audit trail & e-signatures | Continuous / IT-QA |
| Annex 11 | Validation report & SOPs | Semi-annual / QA |
Vision-based Defect Detection (Computer Vision)
Result: ppm defects trend to <1,000 with confidence intervals. Standard: ISO 2859-1 sampling. Steps: label datasets, retrain models, centerline thresholds, verify FAT. Risk boundary: if false positives > 5% per 500 samples, rollback model.
NLP Workflows for Changeover
Use natural language prompts to auto-generate SOPs; Changeover at 18–22 min. Standards: ISO 9001 doc control; Annex 11 validation. Steps: capture tribal knowledge, synthesize SOP, e-sign, train. Risk boundary: if deviation logs > 2 per shift, trigger review.
Transitioning to Renewable Energy Sources
Conclusion: supplier scorecards should index renewable integration by kWh/pack and CO₂ per pack. Metric: moving from 0.12 to 0.095 kWh/pack lowers CO₂ to 35–38 g/pack at 50% solar mix. Apply ISO 50001; ensure NFPA 70 electrical safety for inverters. Steps: conduct energy audit; select PPA; tune servo profiles; standardize idle policies; monitor DC bus temp. Risk boundary: if DC bus exceeds 650 V at 40°C ambient, derate. Governance: energy committee logs decisions in Annex 11-compliant system. References: ISO 50001; NFPA 70; inverter manuals; energy audit records.
AI models forecast energy demand by SKU and shift, aligning load with renewable availability. Track OEE across on-peak vs off-peak; guard kWh/pack at 0.10 under high-speed runs. Steps: schedule batches with demand forecast; debottleneck conveyors; tune drives; validate MTBF under new profiles; verify lockout-tagout. Risk boundary: if OEE falls below 70% during PPA curtailments, reschedule. Governance: operations reviews weekly with CFO and EHS. References: ISA-95; ISO 50001; EHS SOPs; PPA terms.
Solar PPA vs Onsite CapEx
Compare Payback 14–20 months (PPA) vs 18–26 months (CapEx). Standards: ISO 50001 energy baselines. Steps: model tariffs, evaluate incentives, select mix, validate SAT. Risk boundary: if delivered power variability > 15%, keep onsite buffer.
Smart Drives Tuning
Servo tuning trims kWh/pack to 0.095. Standard: IEC 61800-5-2 functional safety. Steps: characterize load, auto-tune, set jerk limits, monitor heat. Risk boundary: motor temp > 85°C triggers rate cap.
Predictive Analytics for Future Demand Planning
Conclusion: AI demand signals stabilize Changeover and inventory with GS1-compliant traceability. Maintain forecast error < 10% at SKU level; hold OEE 72–75% with FPY ≥ 98%. Standards: GS1 for serialization; ISA-95 for planning hierarchies. Steps: integrate ERP; fit time-series models; segment by pack size; centerline run rates; align maintenance windows. Risk boundary: if backlog > 12 hours for A-SKU, invoke overtime plan. Governance: S&OP minutes archived under Annex 11. References: GS1 General Specifications; ISA-95; Annex 11; S&OP records.
Case: for "anova culinary precision ASFL vacuum sealerealer pro" SKUs, predictive learning corrected seasonal spikes, keeping Changeover near 19 minutes and kWh/pack at 0.10. Steps: retrain weekly; validate IQ/OQ/PQ per new recipes; tune vision thresholds; publish e-sign SOPs. Risk boundary: if FPY dips below 97.5% for two consecutive lots, pause promotions. Governance: demand council reviews with QA and finance. References: IQ/OQ/PQ reports; 21 CFR Part 11; GS1 aggregation; forecast dashboards.
SKU-level Forecasting
Granular modeling retains FPY ≥ 98% while meeting GS1 aggregation. Steps: cluster SKUs, fit models, align staffing, audit results. Risk boundary: if forecast bias > ±8%, escalate.
Spare Parts Predictive MTBF
Predict MTBF > 2,800 hours for seal bars and vacuum pumps. Standard: ISO 14224 data taxonomy. Steps: collect failure logs, fit survival curves, set reorder points, verify SAT. Risk boundary: if MTTR trend > 45 minutes, add spares.
Lessons Learned from Successful Packaging Projects
Conclusion: governance plus AI analytics yields steadier operations and traceable outcomes. Maintain OEE at 72–75% with Changeover 18–22 minutes; ppm defects under 1,000 using ISO 2859-1. Standards: ISO 13849-1 PL d safety, GS1 for aggregation, 21 CFR Part 11 for signatures. Steps: codify SOPs; centerline recipes; run FAT/SAT; lock tolerances; schedule PM; audit weekly. Risk boundary: if audit trail gaps exceed 1 per 1,000 records, halt shipments. Governance: steering committee approves via QMS. References: FAT/SAT; QMS SOPs; ISO 13849-1; GS1.
Customer feedback, including "vevor chamber ASFL vacuum sealerealer reviews", highlighted how computer vision reduced false rejects while NLP SOPs trimmed Changeover variation. Metrics: kWh/pack held at 0.095; FPY sustained at 98.1%. Steps: align supplier scorecards with Payback targets; verify Annex 11; enforce SPC; publish scorecard results. Risk boundary: if Payback drifts beyond plan by > 3 months, initiate supplier remediation. Governance: quarterly business reviews capture evidence with e-signatures. References: SPC logs; Annex 11; 21 CFR Part 11; QBR minutes.
Q&A: Selecting Vacuum Sealers
Question: what is the best vacuum sealer for food to buy? Scorecards test seal integrity, MTBF > 2,500 hours, and FPY ≥ 98%. Standards: ISO 2859-1 sampling; GS1 labeling. Steps: run AQL tests, validate safety PL d, compare energy per cycle, review SAT. Risk boundary: leak rate > 3% triggers vendor rejection.
Final note: supplier scorecards that incorporate AI, standards, and measured outcomes anchor **ASFL** line decisions to quantifiable value with governance-ready records.

