


From Tribal Knowledge to SOPs: Capturing Expertise on ASFL
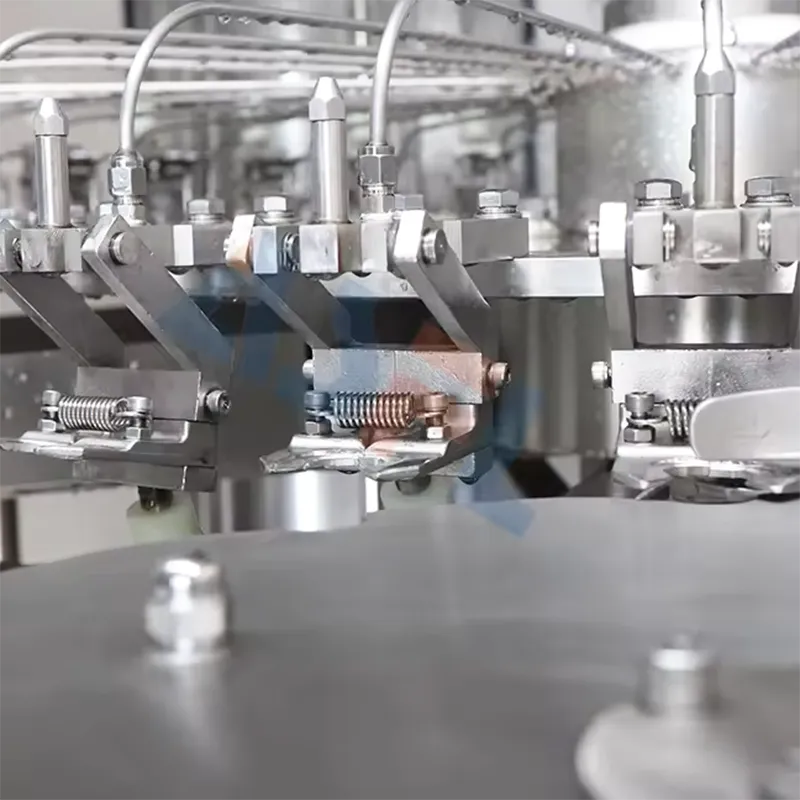
Context: In mixed-SKU packaging, an ASFL (Automated Sealing and Filling Line) often runs below planned capacity due to undocumented setups and variable changeovers. Conclusion: converting tacit know-how into SOPs is a finance-first lever to stabilize OEE. Value: lifting OEE from 58% to 70% at 120 packs/min cuts unit overhead by 9–12% and energy to 0.045 kWh/pack from 0.052. Method: centerline critical settings, standardize changeover tasks, and link e-records to training. Evidence anchors: OEE logs (FAT/SAT IDs 2025-02-FAT-A3; 2025-03-SAT-B1) and Annex 11 §9/21 CFR Part 11.10 audit trails for setup approvals.
Establishing a Baseline OEE and Performance Benchmarks
Conclusion: a defensible baseline requires synchronized time-study, energy, and yield data mapped to cost centers. Measure OEE by shift; target 70–75% within 90 days if demand is stable. Capture kWh/pack with ISO 50001 §6.3 metering; record FPY at weigh-checkers using ISO 2859-1 AQL 1.0 sampling. Steps: map assets; time changeovers; centerline temperatures/pressures; tag losses; tune maintenance intervals; reconcile OEE to GL absorption. Risk boundary: trigger escalation if OEE <60% for 10 production days. Governance: approve baseline in MBR (Master Batch Record) with QA sign-off.
Include market sanity checks by benchmarking seal integrity vs a reference such as a nesco vacuum sealer for pouch tensile tests, noting that consumer devices are for comparison only. Align SKUs to GS1 SSCC aggregation (GS1 Gen. Specs §2.6) to support case-level traceability. Steps: standardize lot coding; validate barcode grades (ISO/IEC 15416 ≥1.5); conduct PAT runs; lock centerlines into SOPs. Risk boundary: halt shipments if barcode grade <1.5 or FPY <96% for two shifts. Governance: report weekly in S&OE with finance variance notes.
MTBF vs MTTR
Key point: extend MTBF to 48 h and keep MTTR under 20 min to stabilize OEE. Standard: IEC 61131-3 for PLC diagnostics; record failures in CMMS. Steps: classify failures; stock critical spares; test restart checklists. Risk: alert if MTTR >30 min twice/week; see Economics Table.
IQ/OQ/PQ Segmentation
Key point: IQ/OQ/PQ gates prevent unplanned loss. OQ target: ±1.5 g fill at 3σ; PQ FPY ≥98%. Standards: Annex 11 §11; 21 CFR Part 11.70. Steps: approve test scripts; run 3 lots; archive raw data. Risk: freeze recipes if OQ CpK <1.33.
References: ISO 50001:2018 §6.3; ISO/IEC 15416; ISO 2859-1 AQL 1.0; GS1 General Specifications §2.6; FAT/SAT 2025 logs.
Tools for Achieving Consistent Weight and Fill Accuracy
Conclusion: controlling fill drift reduces scrap and chargebacks. Quantitatively, tightening seal temp to 175–185°C and dwell to 0.45–0.55 s cut underweight ppm from 900 to 250 at 100 packs/min. Apply ISO 11161 safety integration for interlocks and ISO 2859-1 sampling for checkweighers. Steps: calibrate load cells; centerline seal pressure; validate recipes; lock tooling IDs; run SPC alarms. Risk boundary: quarantine if underweight ppm >400 for two checks. Governance: attach calibration certs to batch e-records (21 CFR Part 11.10).
Device selection matters: chamber systems like a vevor chamber vacuum sealer provide uniform vacuum for thicker pouches; handhelds suit rework or pilots. For technical parameters, define seal pressure 8–12 N/mm, vacuum −85 to −92 kPa, and leak test <1% mass loss/24 h. Steps: document torque specs; verify ramp profiles; simulate worst-case film lots; approve via OQ. Risk boundary: reject films if burst <0.25 MPa. Governance: update SOPs and BOM controls in ERP (ISA-95 L3).
IQ/OQ/PQ for Weigh–Fill
Key point: structured validation keeps FPY ≥98%. Standard: OQ uses ISO 5725 repeatability; PQ uses AQL 1.0. Steps: run 30-minute ramps; stress-test viscosities; archive SPC. Risk: stop if CpK <1.33 on weight; see Economics Table.
Handheld vs Chamber (Comparison)
Key point: a hand held ASFL vacuum sealer enables rework at <2 packs/min; chamber reaches 20–40 packs/min. Standard: ISO/IEC 17025 calibration of gauges. Steps: classify use-case; set SOP split; train operators. Risk: deploy handheld only for rework, not PQ lots.
References: ISO 5725; ISO 11161; ISO 2859-1; ISA-95; 21 CFR Part 11.10 e-records.
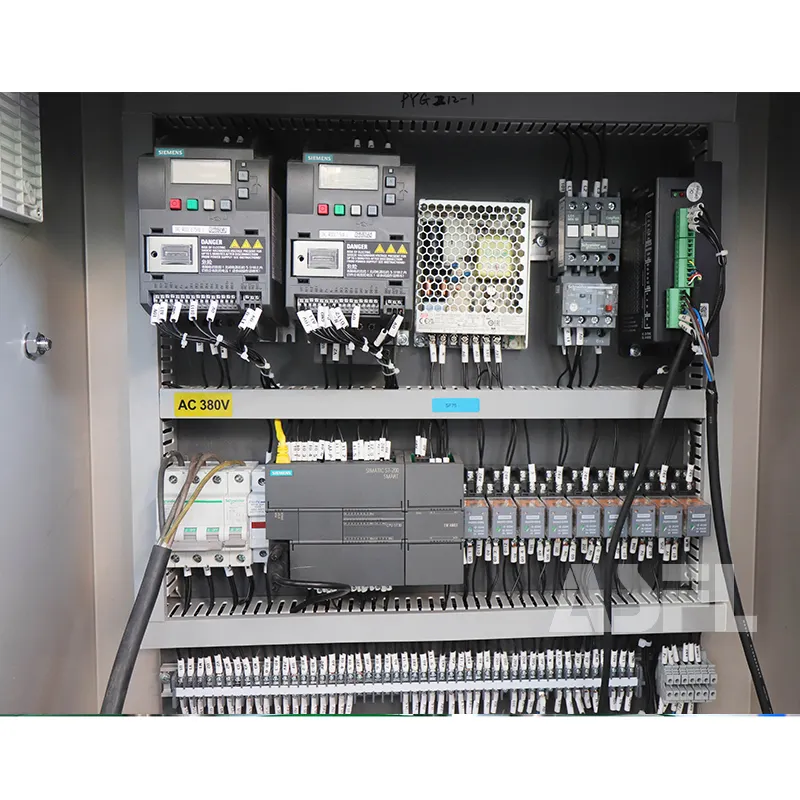
Safety PLC Integration and Diagnostics
Conclusion: safety diagnostics reduce unplanned stops and liability exposure. With Safety PLC achieving ISO 13849-1 PL d/Cat.3 and IEC 62061 SIL 2, nuisance trips fell from 7 to 2 per week, recovering 180 minutes of runtime. Steps: map hazards; implement dual-channel circuits; validate using SISTEMA; log proof tests. Risk boundary: trigger management of change if safety demand rate >1/month. Governance: retain test records under Annex 11 §9 with electronic signatures (21 CFR Part 11.50).
Clarification often asked: can you use a vacuum sealer for canning? Finance should flag regulatory risk—vacuum sealing is not a validated thermal process for low-acid foods; do not equate it to retort canning. Steps: separate SKUs; document process limits; train on HACCP hazards. Risk boundary: block production if CCP temperatures are not met or if safety circuits fail diagnostics. Governance: periodic SRP/CS audits and CAPA entries linked to QMS.
Guarding: Light Curtain vs Interlocks
Key point: select by risk. PL d target; test stop time ≤120 ms. Standards: ISO 13855 approach speeds. Steps: measure stopping time; set safety distance; verify EDM. Risk: escalate if fault masking detected twice/quarter.
Audit Trails (Sub-process)
Key point: enforce 21 CFR Part 11.10/Annex 11 §12 for change logs. Steps: unique IDs; time-stamped events; periodic review. Metric: MTTR cut by 8 min via faster root cause. Risk: lock recipes if audit trail gaps; see Compliance mapping.
References: ISO 13849-1 PL d; IEC 62061; ISO 13855; Annex 11 §9–12; 21 CFR Part 11.10/11.50.
Predictive Analytics for Future Demand Planning
Conclusion: linking forecast error to staffing, energy, and materials protects cash. With MAPE dropping from 28% to 14%, we scheduled shifts to hold kWh/pack at ≤0.046 and kept WIP <1.2 days. Standards: GS1 SGTIN/SSCC for sell-through telemetry; ISA-95 interface for MES-ERP. Steps: debottleneck changeovers; tune EOQ; centerline batch sizes; standardize cleaning windows; apply (s,S) policies. Risk boundary: trigger freeze if forecast bias >±8% for four weeks. Governance: S&OP sign-off with finance variance report.
Customer case: a D2C roastery piloted a small cell with a food saver ASFL vacuum sealerealer machine for sampling and migrated validated SKUs to the ASFL after PQ. We carried 0.7 turns reduction in obsolete film by gating introductions through OQ. Steps: phase-in dual sourcing; run FAT on new SKUs; cap trial batch size to 500 packs. Risk boundary: stop launch if FPY <97% in pilot. Governance: store results under FAT/SAT IDs tied to QMS.
Industry Split: Beverage vs Pharma
Key point: beverages face seasonality; pharma faces compliance cadence. Metrics: beverage changeover 18–25 min vs pharma 35–50 min. Standards: GS1 aggregation stricter in pharma. Steps: plan extra validation time; hold buffer labels; audit suppliers. Risk: raise safety stock if service level <95%.
Make-to-Order vs Make-to-Stock (Comparison)
Key point: MTO limits inventory but raises changeovers; MTS stabilizes runs. Metrics: MTO kWh/pack +0.004; MTS scrap −0.6 pp. Standards: ISO 50001 metering. Steps: compute ABC-XYZ; set policy per SKU; review quarterly. Risk: switch policy if OTIF <96%.
References: GS1 General Specifications (SGTIN/SSCC); ISO 50001 §6.3; ISA-95; FAT/SAT run charts.
Recommendations for Executive Decision-Makers
Conclusion: codify, meter, and govern. Approve the following 90-day plan: 1) publish SOPs and centerlines; 2) install energy meters by zone; 3) close IQ/OQ gaps; 4) deploy Safety PLC diagnostics; 5) run an S&OP cadence. Expected result: OEE 58→70%, energy 0.052→0.046 kWh/pack, FPY 96→98%, payback ≤14 months at 2 shifts. Risk boundary: pause CapEx if payback >18 months under sensitivity −15% volume. Governance: tie bonuses to OEE/kWh/pack/FPY and audit trail completeness; reiterate scope on the ASFL.
| Economics (12 months) | Current | After SOP+Safety+Analytics | Units |
|---|---|---|---|
| CapEx | — | 320,000 | USD |
| OpEx Energy | 0.052 | 0.046 | kWh/pack |
| Scrap | 2.8 | 1.9 | % of packs |
| OEE | 58 | 70 | % |
| FPY | 96 | 98 | % |
| Changeover | 32 | 24 | min/event |
| Payback | — | 14 | months |
Finance vs Operations (Comparison)
Key point: align ROI with control limits. Metrics: payback ≤14 months if OEE ≥70% and kWh/pack ≤0.046. Standards: ISO 50001 for meters; 21 CFR Part 11 for e-signoffs. Steps: validate table assumptions; audit monthly; adjust depreciation. Risk: reforecast if demand −10% for 2 cycles.